


Enterprise SSD Prices 2026: How to Buy Server Storage Now
Posted by Konstantin Protasov, PCSP on Aug 26th 2026
You have probably seen the number: enterprise SSD prices are up 472%. It is a real figure from a real dataset — and it is also five months old, published by a storage vendor about its own product economics, and already superseded by that same vendor's later data. Most of the articles repeating it mention none of that.
This piece is about a storage line item that has to be spent this quarter anyway: what drives cost per terabyte today, why the used channel is priced off a different clock than the NAND market, how to check a second-hand enterprise SSD before you buy it, and where the used-drive plan falls apart. Interface mechanics are in our SAS vs SATA vs NVMe guide. This one is about money.
The short version, priced August 23, 2026:
- SSD rose about 6.5× year over year; HDD rose 2.45× over the same window, per VDURA's Flash Volatility Index. VDURA sells hybrid flash-plus-disk arrays, so read the index accordingly — but TrendForce's contract data points the same way.
- The famous +472% is an April 2026 figure. VDURA's own August update measures from a later quarter and puts a 30 TB TLC drive at $22,600. The number moved, and the index moved under it.
- Nearline SATA is flat at $25/TB across 12 TB, 16 TB and 20 TB drives; new enterprise NVMe U.2 runs $300–$1,172/TB. That gap is the entire decision.
- Used enterprise SATA and SAS SSDs at 3.84 TB land at $78–$127/TB — priced off a pool of decommissioned hardware rather than this quarter's NAND contracts.
- Tiering beats all-flash by a factor of five. Our arithmetic at the prices below: 100 TB usable costs about $6,600 as hot NVMe over bulk disk, against $37,500 all-new-flash.
- No relief before the second half of 2027, per TrendForce — and DRAM is forecast to go the other way while NAND eases.
The 472% Number, and the Asterisk Nobody Prints
The figure comes from the Flash Volatility Index published by VDURA, a Milpitas storage vendor. In April 2026 it showed a 30 TB TLC enterprise SSD going from $3,062 to $17,500 between Q2 2025 and Q1 2026 — a 472% increase, as Tom's Hardware reported it. Blocks and Files carried the same table, including the QLC line ($2,450 to $15,121) and the headline ratio: SSD capacity went from 4.9× the cost of disk capacity to 22.6×.
First problem: the index is a living dataset and it has been revised. StorageReview published VDURA's updated quarterly table on August 18, 2026. It starts from a different quarter than the April figure did — Q3 2025 at $3,460, where the 472% ran from Q2 2025 at $3,062, so the two headline numbers are measured over different windows. It also shows the SSD-to-HDD multiple peaking and then partially receding even as absolute prices kept climbing:
Off that revised baseline, both TLC and QLC are up roughly 6.5× year over year, and both SSD and HDD added another 5% in July 2026 alone. Erik Salo, VDURA's SVP, framed it in the company's August 11 update as structural rather than a spike: a 5% monthly increase on top of a 6.5× year, he argued, is confirmation rather than relief.
Second problem: VDURA is a vendor, not an agency. It sells mixed flash-and-disk arrays, so an index showing all-flash unaffordable and hybrid sane is an index that supports what VDURA sells. That does not make the dollar figures wrong — they are the most granular public series available and corroborated from outside. It does mean treating the architecture conclusions as marketing and the numbers as vendor-published data.
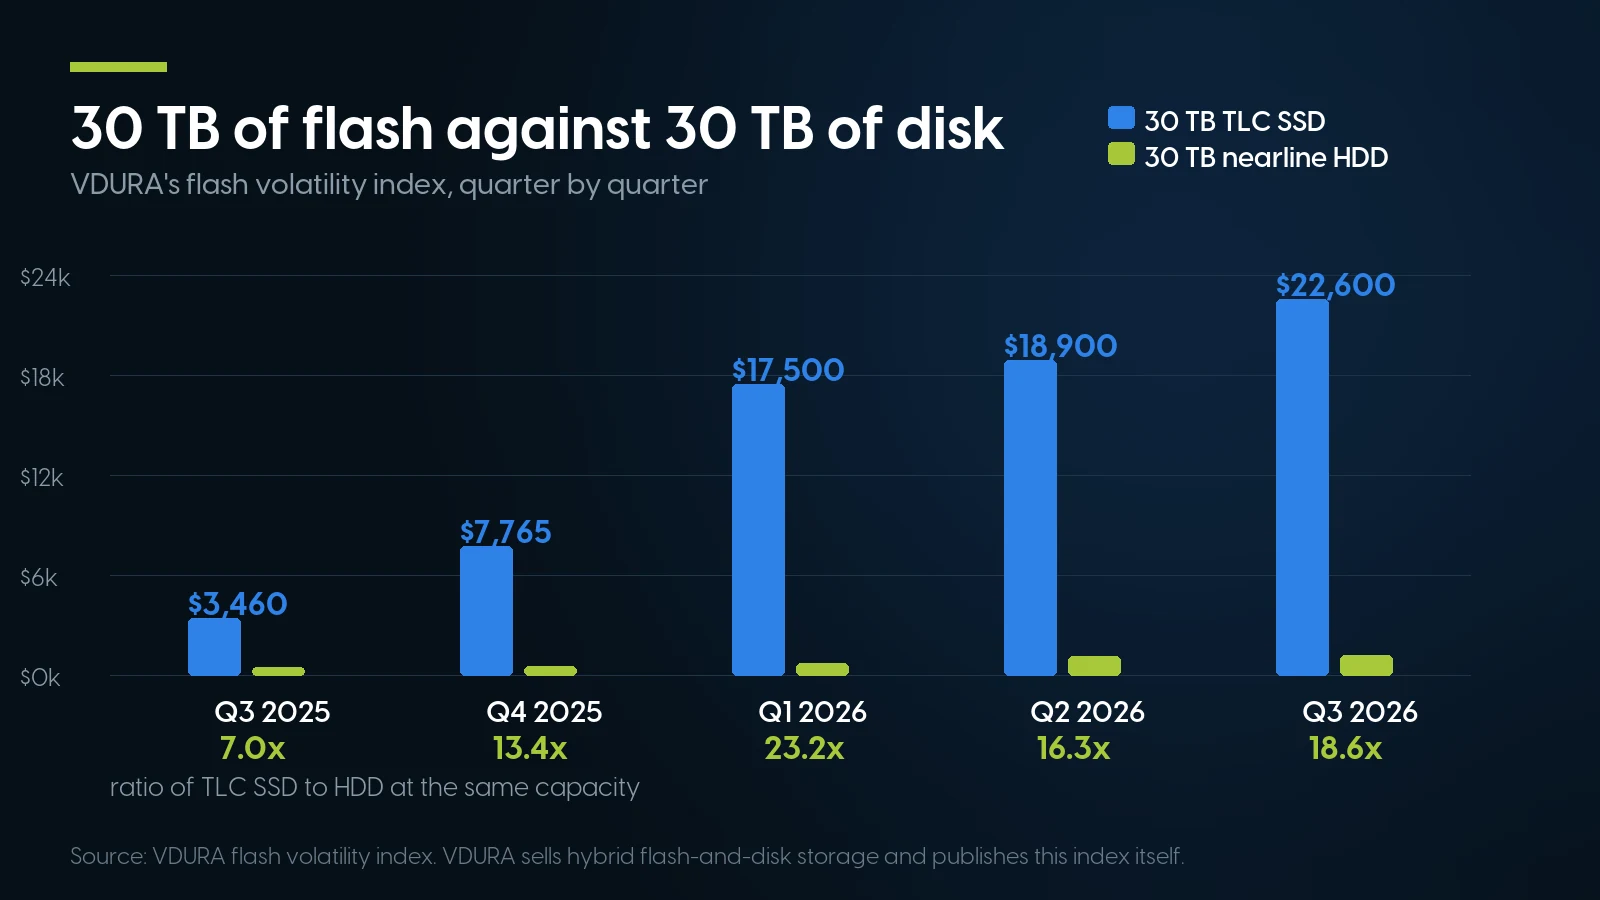
The ratio peaked at 23.2× in Q1 2026 and has since narrowed as disk prices rose too. Source: VDURA flash volatility index — a hybrid-storage vendor publishing its own series.
Disk Rose Too — Just Not Like That
The part that gets lost is that hard drives are also in short supply and also more expensive. On the same VDURA series, a 30 TB-class HDD went from $495 in Q3 2025 to $1,216 in Q3 2026 — +146%, or 2.45×. Serious in absolute terms, and less than half the rate flash moved. That difference is what the rest of this piece turns on.
Supply explains why disk did not escape. Seagate's nearline capacity has been reported as fully allocated through 2026 with 2027 slots now the conversation, and Western Digital as effectively sold out for calendar 2026, with agreements running into 2027 and 2028. Those come from secondary coverage rather than manufacturer statements, so treat them as well-corroborated industry reporting. Toshiba's position we could not verify at all, and the lead-time and spot-premium figures circulating in trade coverage were not traceable to a named source, so we are not quoting them.
On a shelf, that translates to this. Checked August 23, 2026 at ServerPartDeals, nearline SATA priced at a flat $25/TB across three capacities: a 12 TB Exos X16 at $300 (recertified), a 16 TB Exos X16 at $400 (new, five-year warranty), a 20 TB Exos X20 at $500 (recertified). All three showed out of stock at the time of the check — that is the market, not a typo — but the pricing is the last listed pricing and it is consistent.
Flat $/TB across a 12–20 TB band is unusual and useful: capacity per drive is close to free inside it. Buy the largest drive your chassis, rebuild window and failure-domain tolerance allow, and spend the bay count on redundancy instead. Set that against the SSD column below and the decision axis for the whole line item is one ratio — SSD $/TB divided by HDD $/TB, computed on drives you can actually buy, not on a 30 TB index drive neither of us is purchasing.
Why It Happened, in Four Mechanisms
The causal chain is short, and it tells you which parts of the market will unwind and which will not.
- Reallocation, not shortage. Enterprise SSDs took 48% of global NAND bits shipped in Q2 2026, up from 26% a year earlier, per Counterpoint Research data reported in trade press, with an expectation of crossing 50% before the year ends. Every bit going into a datacenter drive is a bit PCs, phones and the channel bid for out of a shrinking remainder.
- QLC became a real tier. AI data lakes created demand for a very-high-capacity, read-mostly flash tier between disk and TLC SSD — where QLC fits. Solidigm's 122.88 TB D5-P5336 ships into exactly that role, with 244 TB-class parts roadmapped. Efficiency claims for QLC against disk come from vendor-commissioned research, so the percentages are left out.
- Allocation is contractual, ahead of supply. North American cloud providers have signed multi-quarter agreements reserving output into 2027. When the largest buyers lock supply by contract, the open channel does not absorb a proportional share of the shortfall — it absorbs the volatility. Hence channel pricing spiking harder than contract pricing.
- Fab discipline after the last glut. Labelled here as informed synthesis rather than a sourced claim: NAND makers cut output and investment through the 2023–2024 downturn, and the capacity not built then is the capacity missing now. Consistent with the analysts' timeline, but we found no single citable source stating the chain outright.
Nothing on that list is temporary the way a shipping disruption is temporary. Three of the four are contracts and capital plans with multi-year horizons.
What Server Drives Actually Cost: $/TB, August 23, 2026
Every price below was checked on a live listing on August 23, 2026. Retailer is in the last column: PCSP is our own catalog, SPD is ServerPartDeals, SS is ServerSupply, NE is Newegg. Condition drives $/TB, so it is stated. Nothing is estimated; where we had no checked price, the position is simply absent. Stock moves faster than price right now: at the time of the check every ServerPartDeals hard drive below was out of stock, and so were the Kioxia PM5 960 GB, the Dell G14 3.84 TB and the Dell D7-P5500. Those rows are the last listed pricing rather than something you can put in a cart today.
Four readings matter more than any single row:
- The real-world SSD-to-HDD ratio is not 18×. The cheapest used enterprise SSD here is $78/TB against $19–$25/TB nearline — roughly 3× to 4×. The index ratio applies to new 30 TB drives bought against current NAND contracts. A 3.84 TB drive out of a 2019 PowerEdge is priced off a decommissioned pool, and that pool does not know what wafers cost this month.
- New NVMe is where the crunch lives. $300 to $1,172 per terabyte across the class, and 2.3× between the Kioxia CM7-R and the Micron 9550 Pro at the same 7.68 TB capacity. Different generations and performance tiers, not one drive at two prices — but it means shopping the specific part number is worth real money.
- Small capacities are a trap. A 240 GB SATA SSD at $146/TB and a 960 GB SAS SSD at $300/TB cost more per terabyte than 3.84 TB drives at $78–$127. You are paying for controller, PCB and enclosure across very little NAND. Buy boot-class capacities only for boot.
- Retailer and condition spread is wide. Our own refurbished 16 TB Exos X16 lists at $663.97 — $41/TB, well above the recertified pricing above. Price the listing, not the category.
Price the array, not the drive
Send us the capacity, the workload and the chassis. We'll come back with a tiered configuration and a flat all-flash one, priced side by side, so the trade-off is a number rather than an opinion.
Enterprise SSDs Request a quoteBuying Used and Off-Lease Enterprise SSDs
This is where a buyer can genuinely act. Off-lease enterprise SSDs come out of three-to-five-year refresh cycles, and the ones doing read-intensive work — most of them — have consumed very little of their rated endurance. But "very little" has to be verified per drive: two identical part numbers can arrive with wildly different histories, and there is no market-wide statistic for remaining life on off-lease drives. Anyone quoting you one is guessing. The substitute is fifteen minutes with smartctl.
The commands
# Debian/Ubuntu
sudo apt install smartmontools

# Full report, NVMe
sudo smartctl -a /dev/nvme0

# Full report, SATA or SAS
sudo smartctl -a /dev/sda

# The four fields that decide it, on NVMe
sudo smartctl -a /dev/nvme0 | grep -E \
  'Percentage Used|Available Spare|Data Units Written|Power On Hours'

# Short self-test (~2 min), then re-read the report
sudo smartctl -t short /dev/sda
sudo smartctl -a /dev/sda
What to read, and what it means
The last two rows are vendor-specific and unreliable in the field — manufacturers implement them differently, and sysadmins have complained about their accuracy for years. That is why the writes-versus-rating row matters more than the others.
The DWPD math, which does not lie
DWPD — drive writes per day — is how many times the drive's full capacity can be rewritten daily for the length of its rating and still meet spec. Turn it into a total: rated lifetime writes = DWPD × capacity × 365 × warranty years. Take the 3.84 TB, 1 DWPD, five-year drives that dominate the used market: 3.84 × 1 × 365 × 5 = 7,008 TB, about 7 PB. If SMART reports 400 TB written, the drive has consumed roughly 6% of rated endurance — and that holds however the vendor scaled its wear-out attribute, because it is arithmetic on a counter rather than an interpretation of one.
One thing you cannot look up: Backblaze does not publish an SSD-versus-HDD failure comparison. Its Drive Stats reports explicitly exclude SSD boot drives, so any enterprise SSD AFR attributed to Backblaze is fabricated. What Backblaze does publish is useful on the disk side: a 1.36% annualized failure rate for 2025, down from 1.55% in 2024, 1.24% for Q1 2026, a lifetime rate of 1.39%, and 0.85% across newly deployed 20 TB-plus drives. Its work on the bathtub curve also found the curve no longer describes modern drives well — recent cohorts fail less and flatten with age, though behavior varies enormously by model. At 2026 replacement prices, retiring a healthy five-year-old drive on a calendar rule is a much harder case to make than it was two years ago. Replace on evidence.
Sizing Honestly at 2026 Prices
Most storage budgets in 2026 are broken by a specification written in 2023, when flash was cheap enough that "put it all on SSD" was a defensible default. It is not defensible now, and two decisions recover most of the money.
1. Tier, because most of your data is cold
The consistent industry finding is that the majority of unstructured enterprise data has not been touched in over ninety days. Figures vary by study, so take the direction rather than a precise percentage — whatever the number, it is not a workload that needs $300/TB flash underneath it.
One 100 TB usable target, four ways, using the checked $/TB above and assuming RAID 6 in 8+2 sets (80% efficiency, so 125 TB raw). Our arithmetic on live prices, not a vendor model:
The tiered row buys flash where latency is observable and disk where it is not, at 18% of the all-flash bill. VDURA's own model reaches a similar conclusion at hyperscale — roughly a 4× gap for the same 25 PB, 1,000 GB/s target — but that is a vendor modelling the architecture it sells, which is why we did the small-scale version ourselves. Before committing to a split, run the hot tier through the IOPS calculator: whether 10 TB of NVMe covers your working set is an answerable question.
2. RAID level, priced in dollars rather than opinions
Eight 16 TB nearline drives at $400 each — $3,200, 128 TB raw. RAID 6 gives 96 TB usable at $33 per usable terabyte; RAID 10 gives 64 TB at $50. Reaching 96 TB usable in RAID 10 takes twelve drives, so the mirroring safety margin has a price tag: $1,600 in extra drives, plus four bays you may not have.
Mirroring always consumes exactly half of raw capacity however large the array grows, while RAID 6's two parity drives amortize across more spindles — so from roughly six drives up, RAID 6 costs meaningfully less per usable terabyte. What RAID 10 buys back is rebuild speed and rebuild-window risk, which on a 20 TB drive is not nothing. Settle that with numbers rather than a blog post: put your drive count, capacity and array type into the RAID calculator, which returns usable capacity, IOPS, rebuild time and unrecoverable-read-error risk on one screen.
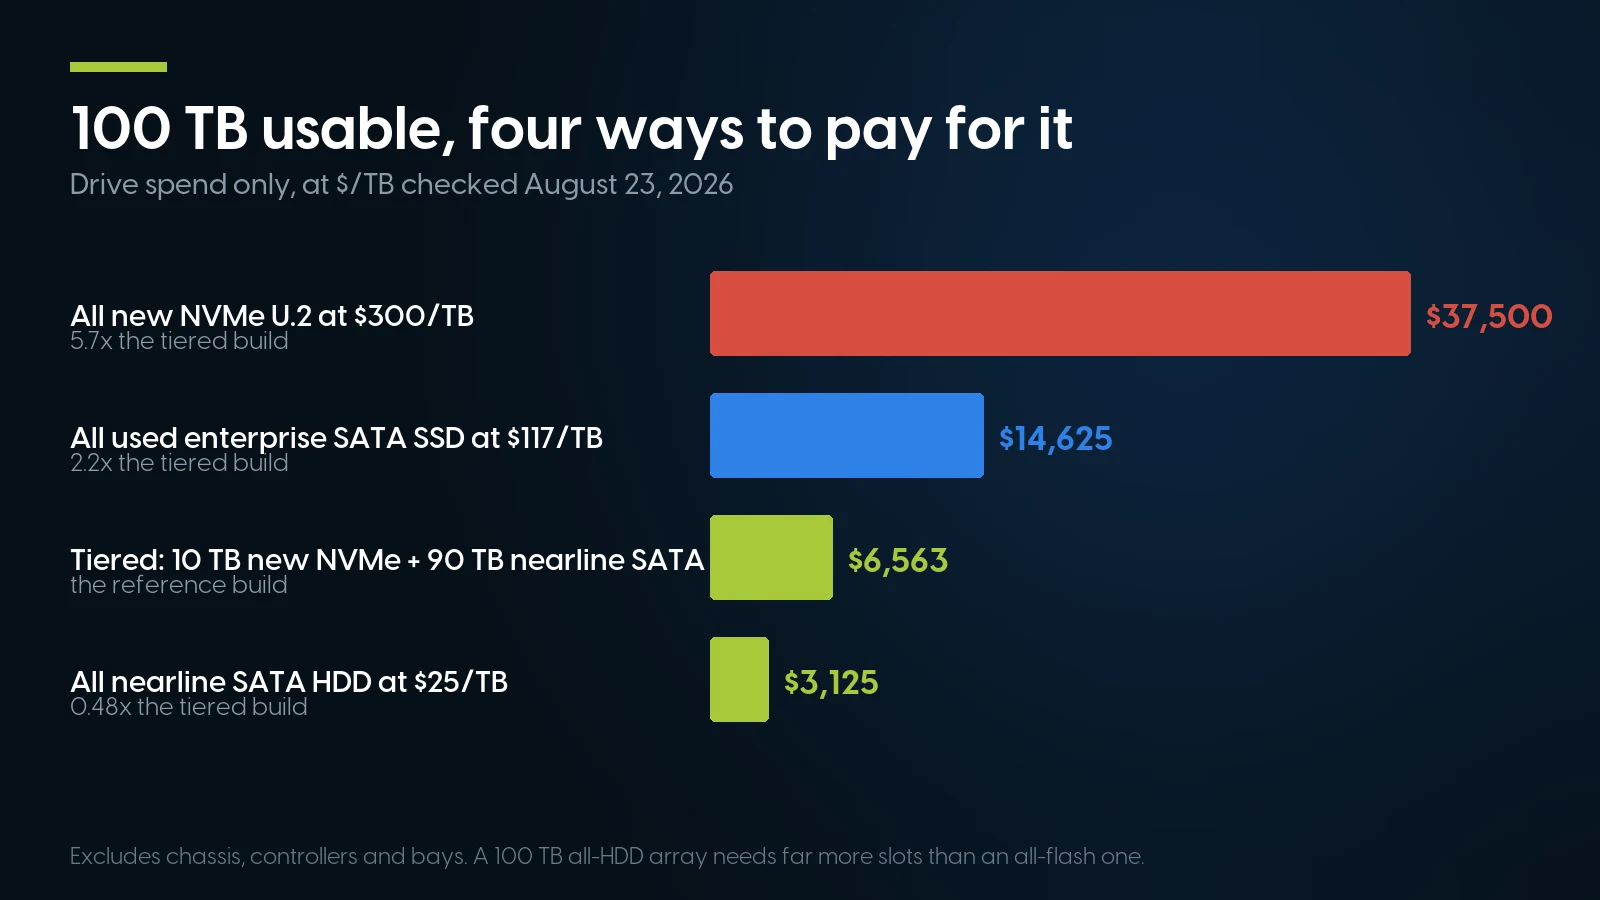
Drive spend only, at the $/TB checked August 23, 2026. Chassis, controllers and bay count are not in these numbers — and the all-disk build needs far more bays.
Caddies, Trays and Firmware: What Actually Breaks
A bare drive at a good $/TB is not yet a working drive. The blockers, in order of how often they bite:
The tray, almost always. A drive without the correct OEM sled does not mount, and a 2.5" drive in a 3.5" bay needs a specific adapter rather than any adapter. This is a part-number problem, not a judgement call — put your server model into the Drive Tray & Caddy Finder for the exact caddy, blank filler and adapter numbers. Budget trays when you budget drives; across twelve bays they are not a rounding error.
Dell PowerEdge: a soft block. The long-documented behavior is advisory rather than functional — third-party drives work, but OpenManage and iDRAC flag them non-certified and you lose clean predictive-failure integration. That documentation comes from earlier generations; we could not find a 2026-dated Dell source confirming 16G and 17G controllers behave identically. If the plan depends on it, test one drive before you buy forty.
HPE ProLiant: more restrictive in practice. On Gen10 and Gen11, third-party drives show the manufacturer's own designation in iLO and Smart Storage Administrator and are flagged unsupported, receive no firmware updates through Service Pack for ProLiant, get limited or no wear monitoring, and make carrier status LEDs unreliable. The one that actually hurts is temperature reporting: a mis-scaled sensor can pin the chassis fans at full speed on a perfectly healthy drive, turning a quiet office ProLiant into something nobody will sit near. These reports come from resellers and community sources rather than HPE documentation, but are consistent enough to plan around.
Lenovo ThinkSystem: undocumented. We could not establish what current ThinkSystem firmware does with non-genuine drives — Lenovo's behavior is simply less publicly documented than Dell's or HPE's, and we would rather say so than guess.
None of this makes the used-drive plan wrong. It makes it a plan that needs a test unit and a tray budget. Which backplane accepts what is covered in the SAS vs SATA vs NVMe article.
When Buying Used Is the Wrong Call
We sell used drives. That does not make them right for every position in an array, and the failure modes are specific enough to list.
- Write-heavy tiers. Transaction logs, write caching, VDI linked-clone pools, Ceph or vSAN metadata devices. These actually consume DWPD, so used endurance headroom is precisely what you are spending — and a 90-day refurb warranty is not a plan for a component you intend to write hard for three years. Buy new, mixed-use or write-intensive, with the five-year warranty.
- Anything with a support contract attached. If a hypervisor cluster must stay on a vendor's hardware compatibility list, or a service agreement requires OEM-certified media, a $78/TB drive that voids it is not cheap. That is a compliance question, not a hardware one.
- Single points of failure. A used SSD as an unmirrored boot device, or as the only copy of anything, is a bad trade at any price. If one drive's loss stops the business, that drive should be new and under warranty.
- When bay count is the constraint. Used enterprise SSDs top out at capacities from three to five years ago. Needing 100 TB in eight bays means current high-capacity drives at 2026 prices; no $/TB argument helps.
- When nobody will actually run smartctl. The whole economic case rests on someone checking wear before deployment and monitoring it after. No monitoring stack, no time, no owner — and the risk-adjusted price of a used drive exceeds its sticker. New drives with warranties are then the honest answer.
One more that cuts against our own interest longer term: used drive prices are set by the supply of decommissioned hardware, which is why they have not tracked the NAND market this year. That decoupling is not permanent. Used pricing follows new with a lag, and the lag has been running out through 2026.
Forecast: Relief in 2H27, and Not for Everything
TrendForce's July 2026 analysis is the most specific forecast we could verify. Its NAND flash sufficiency ratio — supply measured against demand — is forecast to turn positive in 2027, with the constraint easing specifically in the second half of 2027. That is the earliest credible relief, and it is a supply forecast, not a price forecast. Three qualifications belong with it.
- Easing supply is not falling prices. TrendForce attaches a high degree of uncertainty to the 2027 price path itself. A looser market does not mean cheaper drives if demand grows faster than the new capacity — and TrendForce forecasts 2027 server shipment growth exceeding the 17% already recorded in 2026.
- DRAM goes the other way. Most "memory shortage" coverage misses this by treating NAND and DRAM as one blob. TrendForce puts the DRAM sufficiency ratio at roughly −1% to −2% in 2026 with the gap widening in 2027, because new DRAM capacity is delayed to 2028. Storage relief may arrive before memory relief, which matters when sequencing a refresh — see our DDR4 server memory piece.
- The near term is still rising. TrendForce's Q3 2026 view had NAND contract prices up another 10–15% quarter over quarter — a deceleration as OEMs push back, but still an increase.
Several NAND makers have been reported as signalling continued tightness beyond 2026. We could not verify those statements against primary sources, so we are not attributing them by name. The verified picture is enough: no supply relief before late 2027, uncertain pricing after, and a storage line item that has to be spent before then.
Spend the budget where the ratio favors you
Bulk capacity on nearline disk, a small flash tier on top. Every drive we ship is wiped, SMART-tested and listed with its power-on hours, so you can check the wear before it arrives.
Enterprise hard drives All storageEnterprise SSD Prices: FAQ
Why are enterprise SSD prices so high in 2026?
AI datacenter buildout took the NAND supply. Enterprise SSDs accounted for 48% of global NAND bits shipped in Q2 2026, up from 26% a year earlier, and cloud providers have locked allocation into 2027 by contract. Kingston reported NAND wafer prices up 246% since Q1 2025, and NAND is roughly 90% of an SSD's bill of materials. TrendForce forecast a record 53–58% quarter-over-quarter rise in enterprise SSD contract prices for Q1 2026, and later put the finished quarter nearer +80%.
Did enterprise SSD prices really rise 472%?
That figure is from VDURA's Flash Volatility Index as published in April 2026: a 30 TB TLC drive going from $3,062 to $17,500. Two caveats. VDURA's own August 2026 update measures from a different quarter — $3,460 in Q3 2025 — and puts the same drive at $22,600 in Q3 2026, about 6.5× year over year. And VDURA is a hybrid flash-and-disk vendor publishing its own index, not a neutral agency. The direction is corroborated by TrendForce's own contract-price data; the figures are vendor-published.
Did hard drive prices rise too, and what is the SSD-to-HDD ratio now?
Disk rose far less: on the same VDURA series a 30 TB-class HDD went from $495 to $1,216 between Q3 2025 and Q3 2026 - up 146%, or 2.45×, against flash's 6.5×. The index ratio for new 30 TB drives is 18.6× in Q3 2026, down from a 23.2× peak. On drives an SMB actually buys it is far smaller: a used 3.84 TB SAS SSD at $78/TB against nearline SATA at $19–$25/TB is roughly 3× to 4×.
Is it worth buying a used enterprise SSD in 2026?
For read-intensive and general-purpose roles, usually yes: used enterprise SATA and SAS SSDs at 3.84 TB run $78–$127/TB against $300/TB for new NVMe U.2, because used pricing follows the supply of decommissioned hardware rather than current NAND contracts. It is the wrong call for write-heavy tiers, for hardware on a vendor compatibility list, for unmirrored single points of failure, and wherever nobody will check drive wear.
How do I check the wear on a used SSD before deploying it?
Install smartmontools and run smartctl -a against the device. On NVMe read Percentage Used (endurance consumed, so lower is better; 100 means rated life is gone), Available Spare, Data Units Written and Power On Hours. On SAS look for the percentage used endurance indicator; on SATA, Media_Wearout_Indicator, which counts down. Vendor wear attributes are inconsistent, so cross-check against total bytes written versus rated endurance.
What DWPD do I need for an SMB workload?
Usually 1 DWPD or less. Rated lifetime writes are DWPD multiplied by capacity, by 365, by warranty years - a 3.84 TB 1 DWPD five-year drive is rated for roughly 7 PB. File shares, VM datastores, backup targets and boot volumes come nowhere near that. Reserve 10 DWPD write-intensive drives for transaction logs and write caches, and buy those new.
Will a third-party drive work in a Dell or HPE server?
The physical tray is the more common blocker - a bare drive without the correct OEM sled will not mount, and 2.5-to-3.5 inch adapters are model-specific. On firmware, Dell PowerEdge has long applied a soft block: drives function but are flagged non-certified in OpenManage and iDRAC, though that documentation predates 16G and 17G. HPE ProLiant Gen10 and Gen11 are more restrictive: no firmware updates through Service Pack for ProLiant, limited wear monitoring, unreliable carrier LEDs, and temperature misreporting that can pin chassis fans at full speed.
Will SSD prices come down in 2027?
TrendForce forecasts the NAND sufficiency ratio turning positive in 2027, with supply constraints easing in the second half of that year. That is a supply forecast, not a price forecast: TrendForce attaches a high degree of uncertainty to the 2027 price path while forecasting server shipment growth above 2026's 17%. DRAM is expected to move the opposite way, its supply gap widening because new capacity is delayed to 2028.
The Bottom Line
The headline is real and so is the asterisk. Flash capacity did get dramatically more expensive over the past year, on a vendor-published index since revised upward in absolute terms and downward in ratio, corroborated by independent contract data. Disk rose too, at less than half the rate. Anyone quoting one number from April without saying which index it came from, or that the index moved, is repeating a headline rather than reporting a market.
What matters for a purchase this quarter is narrower. The ratio between what flash costs you and what disk costs you, computed on the drives you can actually buy, determines the architecture. At today's checked prices, tiering a small hot NVMe layer over bulk nearline disk costs a fraction of all-flash, RAID 6 recovers real money over mirroring at scale, and the used enterprise SSD channel is priced off a different clock than the NAND market. That last advantage costs you a smartctl check on every drive and a tray budget — and it is the wrong answer entirely for write-heavy tiers and support-contract hardware.
As for timing: no verified forecast puts supply relief before the second half of 2027, and pricing after that is uncertain in the analysts' own framing. That is not a reason to panic-buy. It is a reason to spend this quarter's storage budget on an architecture that assumes flash stays expensive.